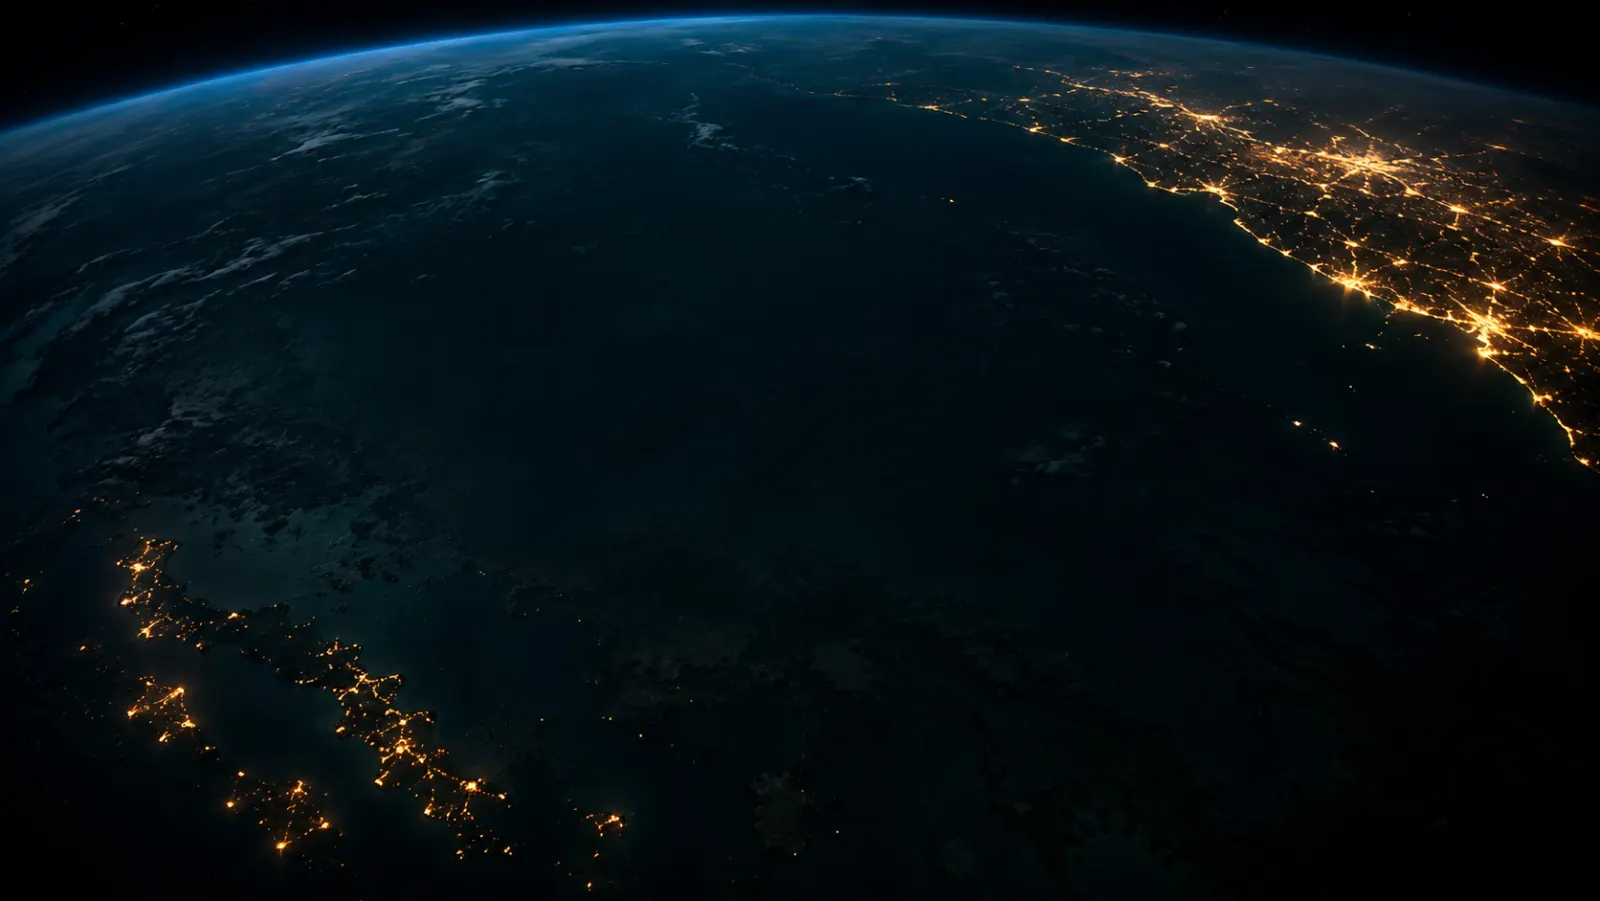
Wir haben die Nacht verloren.
Rund 80 Prozent der Menschen auf der Erde sehen die Milchstrasse von zuhause aus nicht mehr. Dieselben Satelliten, die uns das ikonische "Erde bei Nacht"-Bild geliefert haben, erlauben heute jede Stelle des Globus nach Himmelsdunkelheit zu klassifizieren. Vier Panels führen von der Sprache der Dark-Sky-Beobachter über die Karte zu dem, was sie an Belichtungszeit kostet.
Neun Stufen von Schwarz nach Gelb.
John E. Bortle schlug 2001 eine neunstufige Skala vor, um Astronomen eine gemeinsame Sprache für Himmelsdunkelheit zu geben. Stufe 1 ist der echte unberührte Himmel, an dem die Milchstrasse Schatten wirft. Stufe 9 ist Innenstadthimmel, wo nur noch Mond, Planeten und eine Handvoll Sterne übrig bleiben.
Bewege die Maus über eine Klasse, um die Beschreibung zu lesen.
SQM ist Sky Quality Meter, Magnituden pro Quadratbogensekunde, eine logarithmische Dunkelheits-Messung, bei der jede ganze Zahl etwa 2,5× heller oder dunkler steht. Bewege die Maus über eine Klasse für die originale Bortle-Beschreibung.
Aus dem Orbit verschwimmen alle Lichter.
Der Suomi-NPP-Satellit der NASA hat die Erde bei Nacht im VIIRS-Black-Marble-Komposit aufgenommen. Jeder Pixel wird in eine Bortle-Klasse einsortiert, basierend auf der eigenen Helligkeit und einem 19-km-Area-Median rundherum, damit ein dunkler Park inmitten einer Stadt korrekt nach der Stadt klassifiziert wird, nicht nach sich selbst. Klicke irgendwohin, um den lokalen Himmel zu lesen.
Sterne auf der Karte markieren verifizierte Dark-Sky-Sites. Klicke einen für Bortle und SQM. Pixel über 65° Breitengrad sind desaturiert und schraffiert, weil VIIRS dort rauscht (Winterdunkelheits-Lücken, Polarlicht-Kontamination). Darunter ist die Karte verlässlich. Karte und Farbpalette sind 1:1 aus Astrophotal übernommen. Die Charts darum herum sind Pete-DNA.
Was es kostet, dieselben Photonen einzufangen.
Verdoppelt sich die Himmelshelligkeit, halbiert sich dein Signal-Rausch-Verhältnis, und du musst vier Mal so lange belichten, um es auszugleichen. Über die neun Bortle-Klassen wird Breitband-Imaging exponentiell schmerzhafter. Schmalband-Filter, die nur H-alpha und OIII-Emissionslinien durchlassen, flachen die Kurve dramatisch ab. Bewege die Maus über den Chart, um jede Klasse zu lesen.
- Breitband (LRGB)
- Schmalband 7 nm
- Schmalband 3 nm
t = 10(SQMref − SQMsite) / 2.5 · Schmalband-Filter isolieren Emissionslinien und blocken den grössten Teil der künstlichen Himmelsbeleuchtung.
Referenz ist Bortle 2, ein typischer Dark-Site. Die Kurve nutzt lineare SQM-Interpolation zwischen ganzen Bortle-Werten. Schmalband-Verschiebungen sind konservativ: ein 7-nm-Filter reduziert etwa 60% des Lichtverschmutzungs-Aufschlags, ein 3-nm-Filter etwa 80%. Reale Filter und Kameras schwanken.
Nicht jedes Ziel verliert gleich viel.
Breitband, Schmalband und Planeten-Imaging reagieren völlig unterschiedlich auf Lichtverschmutzung. Welche Disziplin du verfolgst sagt dir, ob ein Bortle-7-Garten unmöglich oder völlig in Ordnung ist.
Breitband (LRGB)
Am stärksten von Lichtverschmutzung betroffen. Das Himmelsleuchten frisst Kontrast in schwachen Nebeln und Galaxienarmen. Beste Ergebnisse von Bortle-1-4-Sites.
Schmalband (Hα, OIII, SII)
Filter, die einzelne Emissionslinien isolieren, blocken den grössten Teil künstlichen Lichts. Funktioniert selbst aus Bortle-7-8-Vorstadtstandorten.
Planeten & Mond
Helle Ziele, die jede Lichtverschmutzung mühelos überstrahlen. Lucky Imaging funktioniert selbst aus Innenstädten.
Die Balken zeigen die ungefähre Sensitivität gegenüber Lichtverschmutzung, nicht die Signalqualität des Ergebnisses. Ein Bortle-8-Garten mit einem 3-nm-Hα-Filter liefert einen wunderschönen Herznebel. Derselbe Garten kann kein Breitband-Andromeda.
Die Karte zeigt die Welt von oben. Der Chart zeigt, was sie kostet, sobald man die Kamera nach oben richtet.
Karte: NASA VIIRS Black Marble (GIBS Earthdata, 2016 Komposit) · 2D-Bortle-Klassifikation pro Pixel (lokale Helligkeit + 19 km Area-Median) · Basemap CARTO Dark, OSM-Contributors · Bortle-Skala: Bortle 2001 (Sky & Telescope). Karte 1:1 aus astrophotal.com/plan/light-pollution gehoben, Charts in Pete-DNA · Alle Charts multi-trigger beim Wieder-Eintritt in den Viewport